
Six Ways to Think About Trees
Feb 262018Trees in computing are an abstract idea with many diverse applications. Visual representations are especially important here, because a lot of ideas about trees are easiest to convey visually. Having more ways to think about trees also makes us more likely to recognise where they’re applicable.
So, in this post we’ll see six different ways to think about and visualise trees:
Much like in the parable of the blind men and the elephant, these are all different views of the same concept, and there is no single “correct” or “best” one. As we go along, we’ll try to show how they really do all represent the same concept of a tree structure, and we’ll also discuss some of the applications each one is relevant to.
Outlines
Our first example is a document, book, or any other text which has sections and sub-sections. The usual way to show the tree structure of the sections is in a document’s outline, or a book’s table of contents:
- Data Structures and Algorithms blog outline
- Data types and memory
- Ones and Zeros
- Binary Numbers
- Booleans
- Memory and Pointers
- Collection types
- Abstract Data Types
- Arrays
- Stacks and Queues
- Exercises
- ADTs and Collections
- Using Collections
- Data structures
- Box-and-Pointer Diagrams
- The ‘Array-List’ Data Structure
- The ‘Linked List’ Data Structure
- The ‘Hash Map’ Data Structure
- Exercises
- Box-and-Pointer Diagrams
- List Data Structures
- Data types and memory
In this visualisation, a tree is represented with nested lists; each node is a list item, and lists have sub-lists representing the node’s children. The root node is the item at the top of the nested list structure. Parent/child relationships are represented by indentation.(1)
Although some items have the same name (e.g. “Box-and-Pointer Diagrams”), each item is uniquely identified by its numbering (e.g. “3. V. i.”).
Our second example of a tree structure is a file system, which has directories and subdirectories. The usual way to show the structure of a file system is a tree view (or tree menu), which looks a lot like an outline:
-
-
-
- Dictionary.docx
- List.docx
- Queue.docx
- Set.docx
- Stack.docx
-
- Array-List.docx
- Hash Map.docx
- Linked List.docx
- readme.txt
-
-
- beach1.jpg
- beach2.jpg
- cat.jpg
- profile picture.jpg
-
- binary.py
- example.py
- hangman.py
- readme.txt
- trees.py
- boot.ini
- pagefile.sys
-
The nodes are the directories and files; files are necessarily leaf nodes.
Nodes may have the same name, but each node is uniquely identified by its path from the root directory.
For example, the path of trees.py is C:\Python\trees.py.
Nested Brackets
Expressions in mathematics and programming languages are another example of a tree structure; an expression like 3 + 4*x has the sub-expressions 3 and 4*x, and the further sub-expressions 4 and x.
In this tree, the leaf nodes are 3, 4 and x, and there are two other nodes representing the + and * operations; their children are the sub-expressions being added or multiplied.
The usual way to show an expression’s tree structure is with brackets; if every expression and sub-expression had brackets, they would look like this:
((3) + ((4) * (x)))
We don’t normally write all of these brackets in expressions, since they’re implied by the order of operations — * has precedence over +.
However, writing all of the brackets shows the tree structure more clearly: each node is represented as a pair of brackets, and its children are nested within those brackets.
(
    ( 3 )
    +
    (
        ( 4 )
        *
        ( x )
    )
)
-
+3-
*4x
Since nested brackets are a textual representation, they’re commonly used when a text format is needed.
HTML is a good example: the idea is the same, but instead of ( and ), HTML elements are opened with <foo> and closed with </foo>.
You can think of the open-tags as open-brackets, and the close-tags as close-brackets:
With clever spacing, we can show that nested brackets represent the same structures as “outlines”: these really are different ways of thinking about the same thing.
["Data Structures and Algorithms blog outline", [
    ["Data types and memory", [
        "Ones and Zeros",
        "Binary Numbers",
        "Booleans",
        "Memory and Pointers"
    ]],
    ["Collection types", [
        "Abstract Data Types",
        "Arrays",
        "Stacks and Queues",
        ["Exercises", [
            "ADTs and Collections",
            "Using Collections"
        ]]
    ]],
    ["Data structures", [
        "Box-and-Pointer Diagrams",
        "The 'Array-List' Data Structure",
        "The 'Linked List' Data Structure",
        "The 'Hash Map' Data Structure",
        ["Exercises", [
            "Box-and-Pointer diagrams",
            "List Data Structures"
        ]]
    ]]
]]
Each node in this structure of nested lists can be uniquely identified by the indices used to access it; for example, outline[1][0][1][2] is "Booleans".
This gives us our first tree data structure; notice that this is already valid Python code.
Nested Areas
The next visualisation shows tree nodes as areas; areas for child nodes are contained within the area for their parent.(2) Using expression trees as an example again, the nested areas representation looks like this:
We can directly relate this to the “nested brackets” representation, showing that the two approaches can represent exactly the same tree structures:
The nested areas representation is especially important in graphical applications, where a two-dimensional area is covered by a tree structure.(3) Returning to HTML, a webpage has a two-dimensional layout determined by the structure of its elements. Hover over the elements or code in the example below, to see how the tree structure determines both the horizontal and vertical layout.
Icicle Diagrams
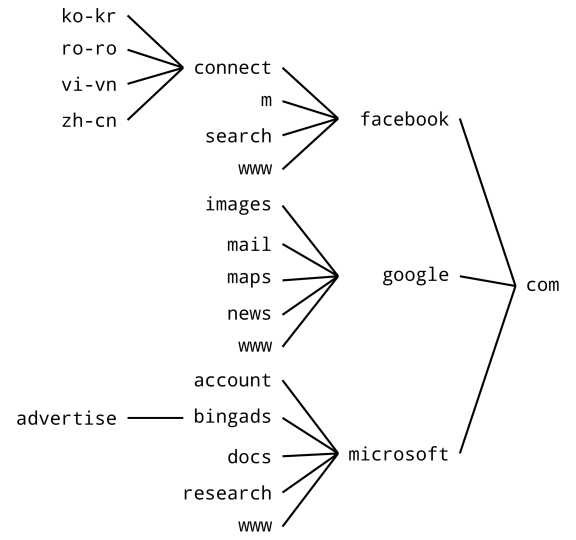
An icicle diagram (or flame graph) shows each node as an area, but instead of nesting the areas, they’re organised either vertically or horizontally. Here’s an icicle diagram of some domain names and their subdomains:
The nodes are represented by rectangles, and children are adjacent to their parents. This example shows children to the left of their parents, since that makes sense for domain names; so the root node is furthest right.
Notice that a node represents part of a domain (e.g. news) rather than an actual domain (e.g. news.google.com), but the ‘path’ to the root node determines the actual domain.
Icicle diagrams are often used when the size of the area represents something meaningful about the node. For example, the diagram below shows the size of every file in the Linux kernel source, organised by directory:
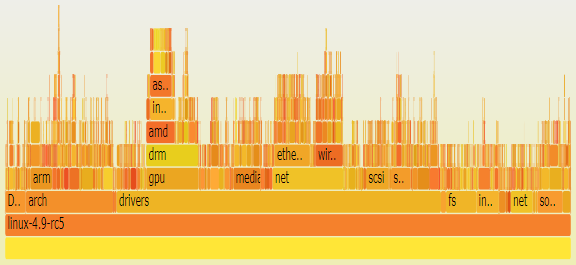
Image credit: Brendan Gregg
From this diagram, we can see that most of the source code is for drivers, and GPU and network drivers are a large part of these. The network drivers are almost all for Ethernet or wireless devices.
To see how “nested areas” and icicle diagrams represent the same tree structures, click the button below:
Node/Link Diagrams
Node/link diagrams are a very common way to visualise trees; if you only know one kind of tree diagram, it’s probably this one.(4) Node/link diagrams explicitly represent the parent/child “links” between nodes, using lines or arrows. This is particularly useful when the nodes and links both have some meaning.
For example, the following diagram shows the fastest rail routes between London and other cities in mainland Britain.(5) The nodes represent cities, and the links represent railway lines:
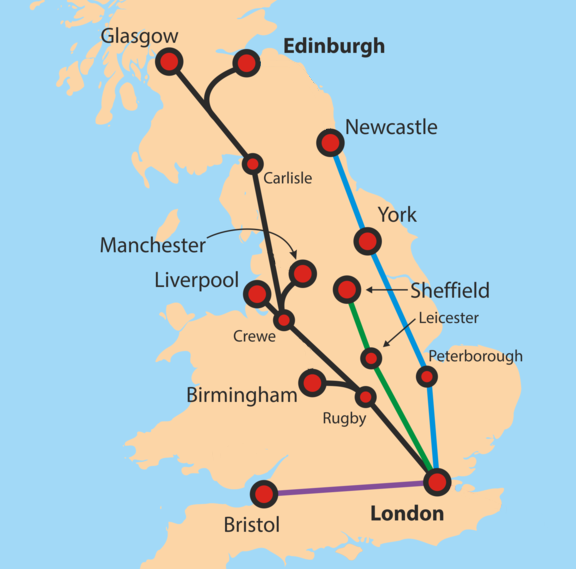
Image credit: Classical geographer (Wikipedia)
London is the root node.
The next example shows the tree structure of domain names again. Child nodes are to the left of their parents, as that’s what makes sense for domain names:
The next example represents the expression tree for 3 + 4*x.
The nodes in this diagram shown as circles, with child nodes below their parents; the root node is therefore the one at the top.

Node/link diagrams can show exactly the same tree structures as the other visualisations; click the button to see how they’re equivalent to “icicle diagrams”.
Node/link diagrams are useful because they’re closely related to box-and-pointer diagrams. If we can draw a tree as a node/link diagram, then we can create a data structure to represent it — the nodes will be objects, and the links will be pointers. This means node/link diagrams are an important tool for thinking about tree data structures.
However, we often only use node/link diagrams to solve problems once we’ve already identified that the data has a tree structure. The other visualisations are important because they help us recognise tree structures in the first place.
Parent Pointers
Most of the time we specify a tree structure, we say what each node’s children are. But we can specify the same tree structure by saying what each node’s parent is, except for the root node (which has no parent). This is potentially simpler, because each node can have many children, but only one parent.
For example, the table below shows the parent of each node in the rail network example. Since the nodes represent cities, the parent is the next city you’ll go to if you’re travelling to London (the root node):
| Current city | Next city |
|---|---|
| Birmingham | Rugby |
| Bristol | London |
| Carlisle | Crewe |
| Crewe | Rugby |
| Edinburgh | Carlisle |
| Glasgow | Carlisle |
| Leicester | London |
| Liverpool | Crewe |
| London | — |
| Manchester | Crewe |
| Newcastle | York |
| Peterborough | London |
| Rugby | London |
| Sheffield | Leicester |
| York | Peterborough |
Hover over the name of a city to find its children in the tree.
This is another textual representation, and it’s hard to visualise the tree structure just using this table. But it is simple and concise, and easy to represent in a computer program — this data can be stored in a dictionary, for example.
We’ve already thought a bit about possible tree data structures, and this is another one; we’ll go into more detail in the next post.
Footnotes
- The total indentation shows the level or depth of a node — how far it is from the root node.
- This visualisation is a special case of an Euler diagram. Euler diagrams in general also allow partial overlapping, but this can never happen for a tree. Two tree nodes either have an ancestor/descendant relationship or not, so their areas are either totally nested or totally separate.
- Or in 3D applications, we can think about “nested volumes” to understand data structures like BSP trees and octrees.
- Node/link diagrams are also commonly used for graphs, which can be used to represent any kind of relationship between pairs of things — not necessarily tree structures.
- This is a tree since there is only one fastest route between each city and London. The complete rail network can be modelled as a graph, but is not a tree since there are multiple routes between some cities. I don’t guarantee that these routes actually are fastest.
There are no published comments.